Start typing to search content
Get the app experience
Data analysis, visualization, statistics, big data, and business intelligence
Related Categories
Snapshot
Recent Contributors
Written by Ashley Stroupe, Operations Systems Engineer at NASA’s Jet Propulsion Laboratory Earth planning date: Friday, Feb. 27, 2026 This week we had three pl…
Visual intuition with Python The post Graph Coloring You Can See appeared first on Towards Data Science.
From the cost of childcare to the housing crisis, there’s no shortage of explanations for the dramatic global fall in the number of babies being born. These an…
Here are the first images of the March 3 'blood moon' total lunar eclipse visible over North America, Australia, and eastern Asia.
Hardy bacteria in a lab survived pressures comparable to an asteroid strike on the red planet, suggesting a hypothetical scenario in which our planet was seede…
A rare Japanese ant is the only species known to lack female workers and males; all of its young develop into parasitic queens that try to take over other colo…
Left-handers are more competitive than right-handers, according to a new study published in the journal Scientific Reports. The findings may help explain why l…
A practical guide to choosing between single-pass pipelines and adaptive retrieval loops based on your use case's complexity, cost, and reliability requirement…
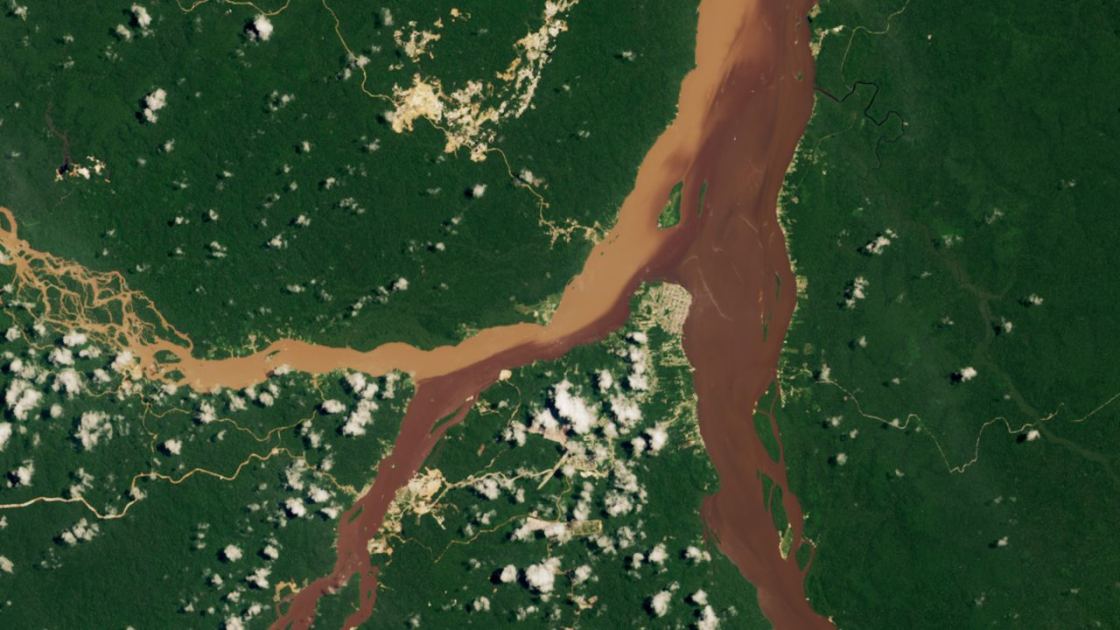
A 2023 satellite photo highlights the point where a trio of rivers converges in Guyana. One of the waterways has been significantly altered by mining waste, cr…
Scroll to load more...
We use essential cookies for security and login, plus optional cookies for analytics to improve performance. Cookie policy
Paste a URL to share with the community